Spray charts for pitchers
March 27, 2013 by Coach McCreary
Filed under Coaching, Pitching
At the high school level and above, charting hitters in the form of “spray charts” is pretty common. A spray chart is typically created for every hitter an opposing team has. Each at-bat is recorded and if they put the ball into play, the
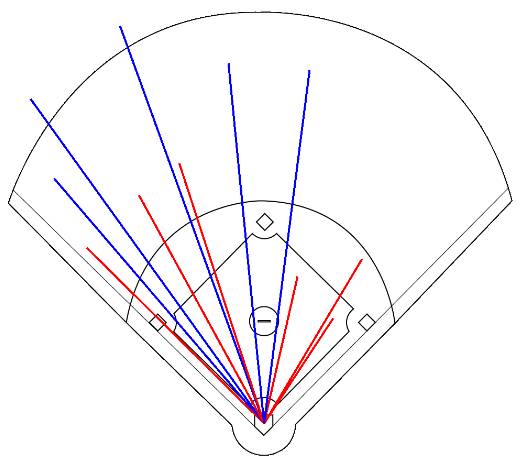
One variation of a spray chart.
chart indicates where they hit it and what the result was. The photo to the right is an example of a spray chart indicating the hitter’s tendancies. Coaches use these charts to position their defense accordingly.
But there is a flaw in this process.
Let’s say an opposing hitter has 20 at-bats over the course of a few seasons at the high school level. Let’s also say that when they put the ball in play, 95% of the time it was hit to the batter’s pull side. But let’s also say that every pitcher that threw against this batter was an average high school pitcher with average velocity. Finally, let’s say you are going to see this batter again tomorrow but this time you have a very hard thrower on the mound. Even if his chart shows him pulling virtually everything, do you still play him to pull against the hard thrower? That’s the problem. Often the most important factor is not who is hitting but who is pitching.
That’s why charting your pitchers can be valuable. Some might say more valuable than charting opposing hitters. Creating one spray chart for each one of your pitchers can allow you to see if there are tendancies as to where most hitters hit the ball off this pitcher. Usually there will be.


Leave a Reply